How to Increase Feature Adoption in SaaS
Alexander Stasiak
Feb 23, 2026・16 min read
Table of Content
What Is Feature Adoption in SaaS (and How Is It Measured)?
Why Feature Adoption Matters More Than Ever for SaaS Growth
Understanding the Feature Adoption Funnel
Stage 1 – Exposed: Make Sure Users Actually See the Feature
Tactics to Increase Feature Exposure
Stage 2 – Activated: Get Users to Try the Feature Once
Tactics to Increase Feature Activation
Stage 3 – Used: Help Users Experience Real Value Quickly
Tactics to Help Users Reach Value Faster
Stage 4 – Used Again: Turn One-Time Use into Habit
Tactics to Drive Repeat Feature Usage
Key Metrics for Tracking Feature Adoption in SaaS
Core Feature Adoption Metrics
Strategies to Increase Feature Adoption Across the User Journey
Cross-Stage Feature Adoption Strategies
Using Qualitative and Quantitative Data to Improve Feature Adoption
Quantitative Methods
Qualitative Methods
Practical Examples of Increasing Feature Adoption
Example 1: Project Management SaaS – “Dependencies” Feature
Example 2: Billing SaaS – “Automatic Dunning Emails”
Example 3: Collaboration Tool – “External Guests” Feature
Common Feature Adoption Challenges (and How to Fix Them)
The Hidden Adoption Killer
Planning and Launching New Features for Higher Adoption from Day One
Pre-Discovery
During Design
During Development
Pre-Launch (2–4 weeks before)
Post-Launch (First 90 Days)
Conclusion: Turning Feature Adoption into a System, Not a One-Off Project
In 2026, acquiring new customers is no longer the primary growth lever for most SaaS companies. The real constraint is how deeply existing customers adopt the features you’ve already built. When users discover, use, and repeatedly engage with specific features, they stick around longer, upgrade more often, and become advocates for your product.
Consider this: research shows that contextual in-app methods like tooltips and product tours drive 3-5x higher feature adoption than email announcements alone. Companies like Slack have famously tied expansion revenue to deeper feature usage by using progressive disclosure—introducing capabilities gradually as users demonstrate readiness. Teams using four or more core features consistently show 2x the retention rates of those who only scratch the surface.
Feature adoption in SaaS refers to the process by which users actively engage with and integrate specific product capabilities into their workflows. It’s not just about signing up or logging in—it’s about moving beyond initial awareness to sustained, meaningful usage that delivers real value. This article will give you practical, immediately usable tactics to increase adoption across your product, then dive deeper into frameworks and metrics you can apply today.
This guide is written for B2B SaaS product managers, founders, and customer success leaders looking to drive feature adoption for specific capabilities—whether that’s a new reporting module launched in 2024, an integration suite, or automation workflows you’ve invested heavily in building. We’ll cover the full feature adoption funnel: exposure, activation, usage, and repeat usage, with concrete tactics for each stage.
What Is Feature Adoption in SaaS (and How Is It Measured)?
Feature adoption happens when users discover, try, and repeatedly use a specific capability within your product—not just sign into the platform itself. Think of features like “Teams,” “Integrations,” “Automation Rules,” or “Pipeline Forecast.” Each represents a distinct value proposition that users either embrace or ignore.
The basic formula for measuring feature adoption is straightforward:
Feature Adoption Rate = (Number of users who used the feature in a given period / Total active users in that period) × 100
Here’s how this works in practice:
- A CRM platform launched “Pipeline Forecast” in 2018. In Q2 2025, the feature adoption rate was 18% of weekly active users.
- A project management tool released “Dependencies” in late 2022. By Q1 2025, 34% of monthly active users had adopted the feature.
- A billing SaaS introduced “Recurring Invoices” in 2023. Within six months, 42% of paying accounts used it at least once.
Feature adoption differs from overall product adoption because it focuses on granular, feature-level engagement rather than broad platform use. A user might adopt Slack for basic messaging but never touch integrations or workflow builders. Understanding this distinction matters when you’re deciding where to invest in your 2025 roadmap—you need to know which specific features drive retention and which are gathering dust.
Why Feature Adoption Matters More Than Ever for SaaS Growth
High feature adoption directly impacts the metrics that matter most: revenue, expansion, and retention. When users adopt “sticky” features—collaboration tools, integrations, audit logs, automation workflows—they become deeply embedded in your product. This drives higher Net Revenue Retention (NRR) because these users are far more likely to expand seats, upgrade plans, and renew year after year.
Consider these scenarios from recent years:
- A B2B analytics platform in 2024 saw churn drop by 23% when customers adopted both dashboards AND alerts, compared to those using only basic reporting.
- A project management SaaS found that accounts using dependencies, custom fields, and timeline views together had 3x higher customer lifetime value than single-feature users.
- A CRM company discovered that teams using their email integration had 67% lower churn than those who didn’t connect their inbox.
Feature adoption gives product teams a clear signal on where to invest. Double down on high-adoption, high-retention features. Rethink or sunset features with consistently low usage.
Here’s the practical reality: improving adoption of already-built features is almost always faster and cheaper than shipping brand-new functionality. The engineering work is done. The feature exists. You just need to help more users realize its value.
The relationship between feature adoption and retention is explored in depth in our guide to reducing time to productivity in SaaS onboarding — the same principles that drive early activation apply throughout the entire customer lifecycle.
Understanding the Feature Adoption Funnel
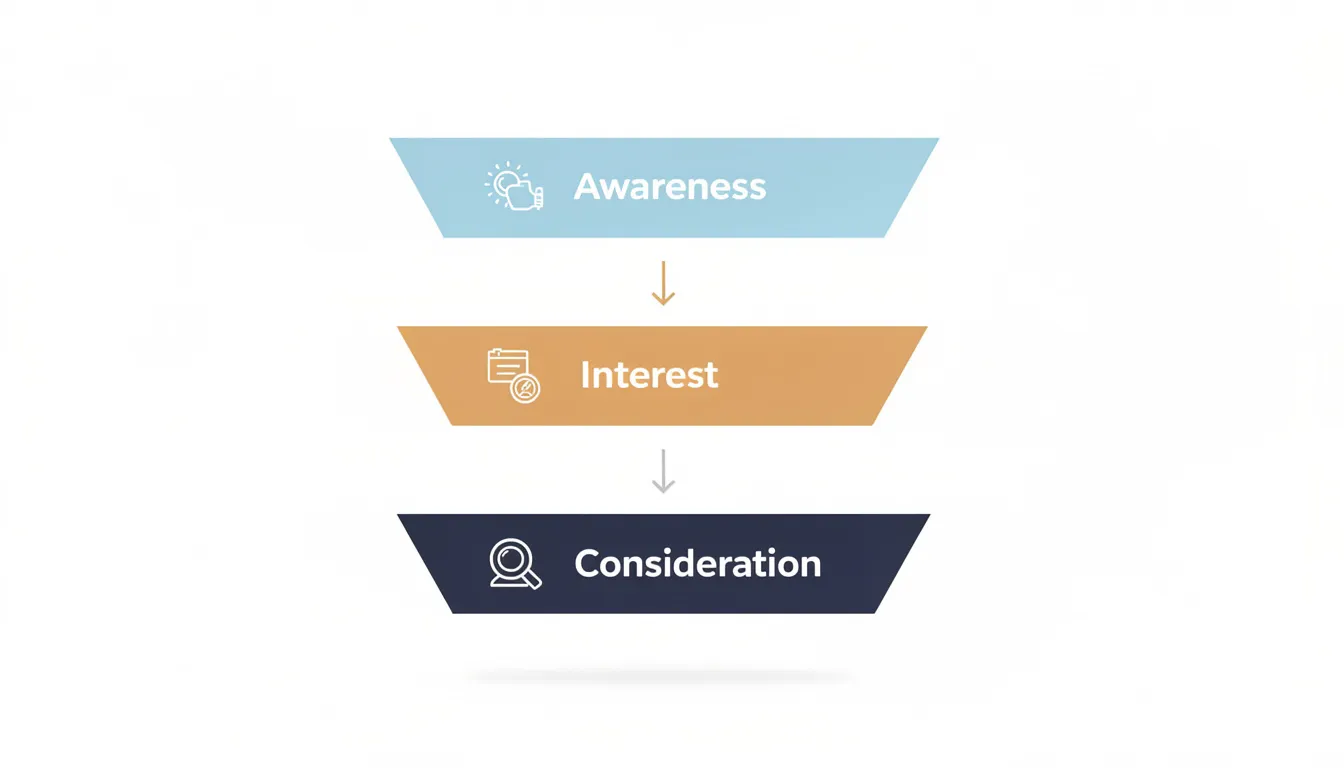
To systematically improve feature adoption, think in terms of a four-stage funnel tailored for SaaS in 2025:
- Exposed – Users encounter the feature in the UI
- Activated – Users try the feature for the first time
- Used – Users complete the core job the feature is designed for
- Used Again – Users return to the feature repeatedly (retained)
The rest of this article maps specific tactics to each stage so you know exactly where to act. Let’s walk through a concrete example:
“Recurring Invoices” feature in a billing platform (launched 2022, tracked Q1 2025):
- Exposed: 78% of active users saw the feature in the invoicing menu
- Activated: 31% of exposed users created their first recurring invoice
- Used: 24% of activated users successfully sent at least one automated invoice
- Used Again: 18% of users who sent one continued using the feature monthly
The critical insight: measure this funnel per feature, not just globally. Bottlenecks differ—some features have low exposure (users don’t know it exists), while others have high trial but low repeat use (the feature isn’t delivering enough value). Understanding where users drop off tells you exactly what to fix.
Stage 1 – Exposed: Make Sure Users Actually See the Feature
Exposure is the percentage of active users who encounter the feature in the UI at least once during a time period. It’s the most overlooked stage because teams assume that shipping a feature means users will find it.
Exposed Rate = (Users who viewed the feature’s screen, button, or tooltip / Total active users) × 100
Many SaaS teams launching new features in 2023–2025 struggle here. Key capabilities get hidden in menus, buried under settings, or tucked into rarely-visited tabs. If users navigate past your feature without noticing it, adoption never starts.
Tactics to Increase Feature Exposure
- Persistent in-app announcements: Use banners or modals for 1–2 weeks after launch, then transition to lighter reminders. This ensures active users during the launch window don’t miss the news.
- Contextual tooltips: Point to the new feature from high-traffic pages. If users frequently visit “Invoices,” add a tooltip there linking to “Recurring Invoices.”
- Feature highlights in onboarding checklists: For new accounts created after your launch date (e.g., post-January 2025), include the feature in their onboarding flow.
- Multi-channel promotion: Don’t rely on in-app alone. Send launch emails, publish changelog posts with the actual release month, and embed short videos in help docs.
- Navigation and IA improvements: Move the feature closer to primary workflows instead of burying it under “Advanced Settings” or “More Options.”
- Feature release announcements in product: Use in app messages to announce when a feature goes live, targeting the user segments most likely to benefit.
In 2024, a B2B SaaS redesign moved “Bulk Upload” from a submenu to the main toolbar. Exposure doubled within the first month, and activation followed shortly after.
Stage 2 – Activated: Get Users to Try the Feature Once
Activation for a feature means the first time a user meaningfully enables or configures it—creating their first automation rule, turning on an integration, or setting up their first recurring invoice.
Activation Rate = (Users who performed the feature’s key activation event / Exposed users) × 100
At this stage, your job is removing friction to first use and increasing motivation to give the feature a try. New users especially need clear guidance on why this feature matters and how to get started quickly.
Tactics to Increase Feature Activation
- One-click trials or smart defaults: Let users enable features with minimal configuration. Pre-built templates for the first workflow dramatically reduce the barrier to entry.
- Benefit-focused microcopy: Near every CTA, explain a concrete benefit and expected time. “Set up in under 2 minutes” with a specific example beats generic “Learn more” buttons.
- In-app walkthroughs: Guide users step-by-step the first time they click into the feature. Keep it to 3–5 steps maximum—any longer and completion rates plummet.
- Safe sandboxes or demo data: Let users see the outcome before connecting real data. A demo analytics dashboard with sample events from 2024 shows value without requiring commitment.
- Customer success team involvement: Have CSMs incorporate the feature into QBRs and 2025 renewal conversations. Offer hands-on setup during calls for strategic accounts.
- Contextual education: Use tooltips that educate users about what the feature does right when they encounter it, helping them understand why they should care.
A marketing automation platform added preconfigured “Welcome Series” email templates in Q3 2024. Activation of the email journeys feature jumped 34% over the following quarter because users could see a working example immediately.
The quality of first-run experiences is ultimately a UX and interaction design challenge — how steps are sequenced, how progress is communicated, and how friction is removed. Startup House's approach to UI design is built around exactly these activation-layer decisions that determine whether users try a feature once or abandon it immediately.
Stage 3 – Used: Help Users Experience Real Value Quickly
“Used” means completing the core job the feature is designed for at least once beyond activation. It’s not just connecting Slack—it’s actually sending an alert there. Not just creating a workflow—but having it execute successfully.
The goal at this stage is compressing time to value from days or weeks into minutes or hours. Users need to experience the “aha moment” quickly, or they’ll abandon the feature before seeing its worth.
Tactics to Help Users Reach Value Faster
- Design for immediate results: Show a meaningful outcome right after the first action. A generated report, sent campaign, or completed automated task provides instant validation.
- Contextual help where users work: Use small inline hints and help icons linking to specific, recently-updated articles instead of generic documentation. User engagement increases when help is relevant and accessible.
- Smart defaults and opinionated presets: Reduce decision fatigue on first use. Most users don’t need 47 configuration options—they need sensible defaults that work.
- In-app nudges for incomplete setups: Trigger helpful reminders like “You created a workflow but haven’t turned it on—activate it to start saving time this week.”
- Surface usage confirmations: Show proof the feature is working. “Your first automated invoice went out on March 1, 2025” reinforces value and builds confidence.
- Reduce time to value explicitly: Track how long it takes users to reach their first success, and continuously optimize that path.
Poor vs. Strong First-Use Experience:
| Aspect | Poor Experience | Strong Experience |
|---|---|---|
| Custom Roles & Permissions setup | 15-step wizard with no defaults | 3-step flow with pre-built templates |
| Time to first role created | 12+ minutes average | Under 3 minutes average |
| Contextual help | Generic link to docs | Inline tooltips with role examples |
| Confirmation | None—just a checkmark | “Admin role created. Sarah now has access to billing.” |
Stage 4 – Used Again: Turn One-Time Use into Habit
This stage measures repeat usage over a defined period—users who engaged with the feature at least 3 times in 30 days, for example. This is where real revenue impact lives. Features that become part of weekly workflows drive renewals, expansion, and ongoing engagement throughout 2025 and beyond.
Retained Feature Users = (Users who used the feature this period AND the previous period) / Users who used it in the previous period
Power users who adopt and retain features represent your most valuable segment. They demonstrate what healthy product adoption looks like and often become internal champions who encourage users around them to adopt the same features.
Tactics to Drive Repeat Feature Usage
- Automate recurring value: Scheduled reports, recurring tasks, or auto-refreshing dashboards that users can rely on every Monday morning create built-in reasons to return.
- Behavioral re-engagement triggers: Send in-app or email nudges when a user hasn’t touched the feature in 14 days but previously used it. “Your automated reports haven’t run in two weeks—want to resume them?”
- Usage-based milestones and light gamification: “You’ve automated 50 tasks since enabling Workflows in February 2025” reinforces progress and builds stickiness.
- Embed features in primary workflows: Show related feature actions directly in the main list or task view, not hidden in separate screens. Users interact more when features appear where they already work.
- Collect feedback from repeat users: Short in-app surveys or feature-specific CSAT questions help you refine UX and performance between quarterly releases. User feedback directly informs improvements.
- Build habits through consistency: The more predictable and reliable a feature’s value, the more likely engaged users will incorporate it into their routine.
A “Saved Views” feature launched in 2023 struggled with retention until early 2024. Adding auto-refresh and pinning to the homepage transformed it into a daily-use feature, with repeat usage jumping from 12% to 41% within two months.
Key Metrics for Tracking Feature Adoption in SaaS
Track feature adoption metrics per feature from day one of launch. A feature shipped in October 2024 should have its own dashboard that product teams review weekly during the first 90 days.
Core Feature Adoption Metrics
| Metric | Definition | How to Use It |
|---|---|---|
| Feature Adoption Rate | (Users who used feature / Total active users) × 100 | Monthly/quarterly health check |
| Exposed Rate | (Users who saw feature / Total active users) × 100 | Identifies discoverability issues |
| Activation Rate | (Users who activated / Exposed users) × 100 | Reveals first-use friction |
| Used-Again Rate | (Repeat users / First-time users) × 100 | Shows if feature delivers ongoing value |
| Time-to-First Use | Days from signup or exposure to first usage event | Shorter is better—target under 7 days |
| Feature Usage Frequency | Weekly or monthly active users for that feature | Tracks engagement depth |
| Feature-Level Retention | Users using feature across multiple periods | Predicts revenue impact |
| Impact on Account Health | Correlation with renewal, expansion, downgrade rates | Proves business value |
Example Dashboard View for a New Feature (First 90 Days):
A PM monitoring a “Custom Dashboards” feature launched in October 2024 might track:
- Week 1-4: Exposed rate trending (goal: reach 60% of daily active users)
- Week 1-4: Activation rate (goal: 25% of exposed users create first dashboard)
- Week 5-12: Used-again rate (goal: 40% of activators return within 14 days)
- Cohort: Compare adoption metrics between free trial users vs. paid accounts
Segment your adoption metrics by plan (free vs. paid), company size, and industry. Product decisions in 2025 should be based on nuanced user behavior, not averages that mask important differences.
Net promoter score NPS and customer satisfaction surveys can complement these quantitative metrics, helping you understand whether high-adoption features also correlate with user satisfaction and loyalty.
Strategies to Increase Feature Adoption Across the User Journey
These strategies tie together the funnel concepts into cohesive initiatives that span the entire customer journey.
Cross-Stage Feature Adoption Strategies
1. Streamline onboarding to introduce 1–3 core features Don’t overwhelm new users with everything. During the onboarding process, focus on the features most likely to deliver immediate value. A focused checklist beats an exhaustive tour.
2. Use personalized in-app communication Segment users by role, use case, or behavior data from 2024–2025 to promote the right features to the right people. In app surveys can help identify which user segments would benefit from which capabilities.
3. Align sales, onboarding, and CS teams around a “core features” checklist Every new implementation should include intentional introductions to your highest-value features. The customer success team plays a crucial role in guiding this process.
4. Run continuous UX improvements on underperforming features Use session recordings, heatmaps, and user interviews with actual customers to identify pain points. Sometimes low adoption isn’t about awareness—it’s about usability.
5. Launch structured re-engagement campaigns for major enhancements When you ship “Version 2.0” of a feature in 2025 that’s significantly better than the 2022 version, treat it like a new launch. Existing customers deserve to know.
6. Guide users through progressive disclosure Don’t show every feature on day one. Help users progress through capabilities as they demonstrate readiness, similar to how Slack introduces core features gradually.
Using Qualitative and Quantitative Data to Improve Feature Adoption
Data alone isn’t enough. You need both numbers and narratives to understand why a feature is or isn’t adopted. The most successful product teams combine quantitative metrics with qualitative insights to build a complete picture.
Quantitative Methods
- Event tracking per feature: Log clicks, creations, and completions with date filters for launches in 2023–2025. Tools integrated with data warehouses like BigQuery allow custom queries that reveal specific bottlenecks.
- Funnel analysis: Track drop-offs from exposure to repeated use. Where are users leaking out of the adoption funnel?
- Cohort analysis: Group users who started using a feature in a specific month and track their retention over 3–6 months. How many users return after their first use?
- Correlation analysis: Connect feature usage to business outcomes like renewal rates, expansion, and customer retention in 2023–2025 cohorts.
Qualitative Methods
- In-app micro-surveys: Trigger short surveys after users complete a feature workflow for the first time. “How easy was that?” with a 1–5 scale plus an optional comment provides valuable insights.
- Customer interviews: Schedule 30–45 minute conversations focused on specific features quarterly. Ask about expectations, confusion points, and what would make users use it more often.
- Support ticket analysis: Review tickets and chat logs tagged with the feature name since launch. Customer feedback from support often reveals friction that analytics can’t capture.
- Usability tests on prototypes: Before larger 2025 redesigns of low-adoption features, test with real users to validate that changes will actually help.
Example: A complex reporting feature launched in mid-2024 showed 40% activation but only 8% repeat usage. Interviews revealed that users found the terminology confusing—“dimensions” and “measures” meant nothing to marketing managers. A copy and layout revamp replacing jargon with plain language increased repeat usage to 23% within two months.
Practical Examples of Increasing Feature Adoption
These short case-style examples show how the framework translates into real results.
Example 1: Project Management SaaS – “Dependencies” Feature
Situation: A PM tool launched “Dependencies” (task relationships that block or trigger other tasks) in late 2022. By early 2024, feature adoption rate was only 14% of weekly active users.
Diagnosis: The feature was buried in a submenu under task settings. Most users never saw it. The funnel showed low exposure (22%) but decent activation among those exposed (38%).
Actions taken:
- Moved the feature directly into the task creation flow as a visible option
- Added a 3-step in-app tour explaining use cases (“Block design tasks until copy is approved”)
- Trained CSMs to showcase dependencies in onboarding workshops with live examples
Result: Adoption doubled from 14% to 31% by Q4 2024. Accounts using dependencies showed 18% higher retention rates.
Example 2: Billing SaaS – “Automatic Dunning Emails”
Situation: A billing platform introduced automatic dunning emails (reminders for failed payments) in Q1 2023. By Q3 2023, only 9% of accounts had enabled the feature despite clear revenue recovery potential.
Diagnosis: Activation was the bottleneck. Users were exposed but hesitant because they didn’t want to configure email copy from scratch.
Actions taken:
- Added three pre-written email templates (friendly, firm, final notice) that users could deploy with one click
- Displayed projected revenue lift in the settings UI: “Accounts like yours recover an average of $2,400/month”
- Sent targeted email campaigns to accounts with high failed payment rates, highlighting the specific dollar amount they were losing
Result: Adoption jumped from 9% to 28% between Q3 2023 and Q1 2024. Median revenue recovery for activated accounts was $1,850/month.
Example 3: Collaboration Tool – “External Guests” Feature
Situation: An external guest feature (sharing projects with clients or contractors) launched in 2021 but plateaued at 11% adoption despite strong demand signals.
Diagnosis: Interviews revealed confusion. “External Guests” sounded technical, and the permissions UI was intimidating. Users worried about accidentally exposing sensitive information.
Actions taken:
- Renamed to “Share with Clients” in 2023, using language that matched how users actually talked about the use case
- Simplified permissions to three clear presets: “View only,” “Can comment,” “Can edit”
- Showcased the feature in in-app banners during a 2024 redesign, targeting teams with project-based workflows
Result: Adoption rose from 11% to 27% over 12 months. User satisfaction scores for collaboration features increased alongside the change.
Common Feature Adoption Challenges (and How to Fix Them)
Most SaaS teams encounter similar patterns when features underperform. Here’s how to diagnose and address the most common issues.
| Challenge | Root Cause | Fix |
|---|---|---|
| Users don’t know the feature exists | Low exposure—hidden navigation, no announcements | Navigation changes, targeted in-app announcements, multi-channel promotion |
| Users see it but don’t try it | Low activation—unclear value, complex setup | Simplify setup, clarify benefits, add templates or one-click activation |
| Users try once and drop off | Low value delivery—too long to first result | Shorten time to value, reduce complexity, provide contextual help during first use |
| Only a small segment uses it | Wrong audience targeting | Re-evaluate positioning, ensure right personas targeted in-app and sales materials |
| Feature is powerful but intimidating | Complexity barrier | Break into guided flows, add suggested defaults, run live training with available recordings |
| Feature adoption stagnates over time | No ongoing engagement strategy | Behavioral triggers, re-engagement campaigns, feature updates announced to existing users |
The Hidden Adoption Killer
Don’t overlook technical performance. A feature with slow load times since a 2022 release will struggle regardless of how well you promote it. If a particular feature takes 8 seconds to load, users will abandon it—even if they understand its value. Audit performance alongside adoption rates.
When you see a low feature adoption rate despite good exposure and initial activation, check technical performance and user experience friction points before assuming the feature isn’t valuable.
Planning and Launching New Features for Higher Adoption from Day One
Apply these lessons to features on your 2025–2026 roadmaps. The goal is to build adoption thinking into every phase, not bolt it on after launch.
Pre-Discovery
- Validate demand with customer interviews and usage data from existing workarounds. If users are already hacking together solutions with spreadsheets or integrations, you have strong signal.
During Design
- Define the “activation event” and success metrics before you write code. What action signals that a user has truly adopted this feature?
- Map the feature adoption funnel stages specifically for this capability.
Defining activation events and success metrics before writing a single line of code is a discipline that belongs in product discovery — the phase where Startup House helps teams align on what 'adopted' actually means for each capability before building begins.
During Development
- Instrument analytics and events in parallel so tracking is live on release day. You can’t improve feature adoption rates if you’re not measuring from day one.
- Build in contextual help and tooltips as part of the feature, not afterthoughts.
Pre-Launch (2–4 weeks before)
- Prepare launch campaigns: in-app announcements, email sequences, changelog posts with real screenshots
- Create help center articles with actual UI examples
- Enable CSMs and sales with talk tracks and demo flows
- Set up your feature-specific dashboard in your analytics tool
Post-Launch (First 90 Days)
- Review funnel data weekly for the first month, then bi-weekly
- Conduct 5–10 user interviews with both adopters and non-adopters
- Ship small UX improvements quickly—don’t wait for a major release
- Iterate weekly in the first month, monthly thereafter
A product adoption strategy isn’t complete until it includes specific plans for how you’ll drive feature adoption after launch—not just what you’ll build.
Conclusion: Turning Feature Adoption into a System, Not a One-Off Project
Increasing feature adoption is an ongoing process, not a launch checkbox. The teams that drive consistent growth treat each important feature like a mini-product with its own funnel, metrics, and continuous improvement cycles.
The concepts in this guide—exposure, activation, usage, and repeat usage—give you a framework for diagnosing exactly where users drop off and what tactics to apply. Whether you’re working on a feature launched in 2022 that never gained traction or planning your Q3 2025 release, the same principles apply.
Here’s your practical next step: this quarter, pick one underperforming feature and walk through the full funnel. Measure how many users are exposed, what percentage activate, how many reach first value, and how many return. You’ll likely find the bottleneck isn’t where you assumed—and the fix might be simpler than building something new.
This week, audit your top 5 revenue-related features and identify where each is leaking users in the funnel. That single exercise will tell you more about where to invest your product and customer success effort than any competitive analysis or feature brainstorm could.
Digital Transformation Strategy for Siemens Finance
Cloud-based platform for Siemens Financial Services in Poland


You may also like...
Value-Added Services (VAS) Examples
By 2026, most core services — data plans, current accounts, cloud hosting — have become fully commoditized, and the companies winning customer loyalty aren't the ones cutting prices. They're the ones layering smart value-added services (VAS) on top: carbon footprint trackers in banking apps, smart-home bundles from ISPs, AI copilots inside SaaS platforms, and Amazon Prime-style subscriptions that turn one-time buyers into long-term subscribers. This guide breaks down concrete VAS examples across telecom, banking, retail, and SaaS, explains why operators offering VAS see up to 30% ARPU uplift, and gives you a practical 5-step framework to identify which value-added services will actually move the needle for your product.
Alexander Stasiak
May 01, 2026・11 min read

Single Source of Truth Knowledge Management
The average knowledge worker spends one full day every week searching for information or recreating work that already exists somewhere. The root cause isn't a lack of knowledge — it's the absence of a single source of truth. Documents live in three wikis, policies conflict across SharePoint and Google Drive, and institutional knowledge walks out the door with every departure. This guide walks you through exactly how to fix that: from defining what SSOT actually means in practice to implementing it phase by phase, governing it for the long term, and measuring whether it's working.
Alexander Stasiak
Feb 19, 2026・17 min read

AI in Customer Success Teams: Playbooks, Tools, and KPIs for 2025–2026
Over 52% of customer success teams now use AI tools weekly — and the gap between early movers and everyone else is widening fast. AI in customer success isn't about replacing CSMs; it's about eliminating the 30–40% of their week spent on note-taking, data synthesis, and repetitive prep work — so they can focus on the relationships and strategic conversations that actually drive retention and expansion. This guide covers the current state of AI in CS, the five core benefits, eight practical use cases, the tools worth evaluating, and the KPIs that matter — with a 90-day implementation roadmap for CS leaders ready to act.
Alexander Stasiak
Feb 24, 2026・20 min read
Ready to centralize your know-how with AI?
Start a new chapter in knowledge management—where the AI Assistant becomes the central pillar of your digital support experience.
Book a free consultationWork with a team trusted by top-tier companies.


